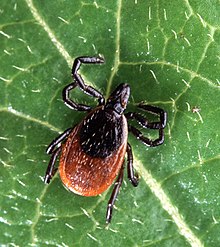
Lyme disease and other tick borne diseases are on the rise in the United States. Not only are the number of cases rising year after year, but where the diseases are occurring is spreading (geographic spread). Thus the establishment of a Lyme and tick-borne disease dashboard by a team of researchers at John Hopkins is welcome news.
The site has a map where people can finally see what the risks are in their area (at the state and county level) and take precautions as needed. The site (which gets updated) also has lots of information and links. Note that diseases are spread by different types of ticks, and that the number of diseases spread by ticks has been increasing.
To give you a sense of how serious tick borne diseases are, the site states: "Using health insurance claims data, CDC has estimated that around 476,000 Americans are diagnosed and treated for Lyme disease each year – a figure that is more than ten times the number of reported cases! The disease is estimated to cost the US health care system between $712 million and $1.3 billion each year, but this cost burden could be even higher if cases are underestimated." [Technical journal article explaining background, methods.]
One current problem not discussed is that a course of antibiotics taken soon after being diagnosed with Lyme disease may fully treat most cases, but not the remaining 10 to 20%. Yikes! Tulane University researchers found that live bacteria (B. burgdorferi spirochetes) can still be there in different organs of the body even after 28 days of antibiotic treatment. [See all Lyme disease, tick posts]
From Medical Xpress: Johns Hopkins team creates Lyme and tick-borne disease dashboard
A team of researchers at Johns Hopkins Bloomberg School of Public Health has created and posted online a free Lyme and tick-borne disease dashboard. The group has published a paper describing the information available on the dashboard and how to use it on the open-access site PLOS ONE.
As the researchers note, tick-borne diseases are on the rise in the U.S., likely due to a warming climate.
They also note that many cases of tick-borne diseases are never reported anywhere, which leaves people in certain areas unaware of the danger around them. In this new effort, the researchers created a dashboard (inspired by those used to track COVID-19) for use by people who want to know about the number of tick-borne disease cases in their area.
The dashboard made its debut last May but has been updated since then. The researchers note that Lyme disease is now the most commonly reported disease in the U.S. spread by insects or arachnids. They also note that scientists continue to discover new diseases that are spread by ticks. To help people understand it all, the researchers collected data from health departments around the country and added them to a database. The information in the database is then represented on a color-coded map of the U.S. Deeper reds, for example, show a state or county with high numbers of infections. The map can also show concentrations of different types of infections, though the researchers suspect its main use will be for tracking Lyme disease. Users can see concentration levels at the national, state and county levels.
The dashboard also allows users to follow trends—tick-borne diseases are seasonal, with the most infections happening in the summer months. Users can watch the numbers increase in their area if they so choose.
The dashboard can also be used to track the spread of other tick-borne diseases, as well, including Rocky Mountain spotted fever, anaplasmosis and babesiosis. Also, users can track the population of the two main kinds of ticks that spread disease. The researchers also included a section called "Geography, Ticks and You," where users can learn more about tick-borne disease and where they are most prevalent.